Bright Lite is building tools to help project developers get to a Notice to Proceed faster with less risk and capital outlay. We are building featured products and a series of additional services for project developers to engage us to deploy a la carte in their regions of interest. Bright Lite can export all of its analysis to easy to consume platforms for developers just getting started, and to advanced platforms for established companies with robust GIS and engineering departments.
Featured Product: Substation & Feeder Line Load Analysis
We perform transmission-grade power flow modeling to map the hourly loads on substations and buses, and are developing next-generation analytics to predict the hourly load on distribution feeder lines. We do this to help developers rapidly assess the viability of interconnecting potential projects at the earliest stages of development.
Developers can engage Bright Lite for substation maps, relative feeder line strength probability maps for wide area prospecting, and specific site loads on substation & feeder lines, subject to disclosure considerations.
Featured Product: Aesthetic Impact Mapping (AIM) Tool for Preserving Scenic Vistas
Bright Lite is developing a tool to help developers and NIMBYs (Not In My Back Yard) literally preserve scenic vistas through renewable energy development. This proactive approach to siting drastically reduces permitting risk.
Bright Lite’s Aesthetic Impact Mapping (AIM) Tool calculates how many people can see each section of ground and airspace from their home, place of work, and commute to determine the least aesthetically impactful places to develop renewable energy. With this intel, developers can secure land rights and interconnection queue position in ways that drastically decrease the interconnection potential of sites on a feeder line that NIMBYs want preserved because those sites have greater impacts on the aesthetics of the community. Then, developers can work with local NIMBYs to ensure their projects are permitted and developed and the scenic vistas the NIMBYs are trying to preserve become no longer profitable for development due to the need for costly system upgrades required for interconnection.
This is another way Bright Lite aligns the interests of developers, community members, and financiers to build stronger communities through faster, more profitable energy development.
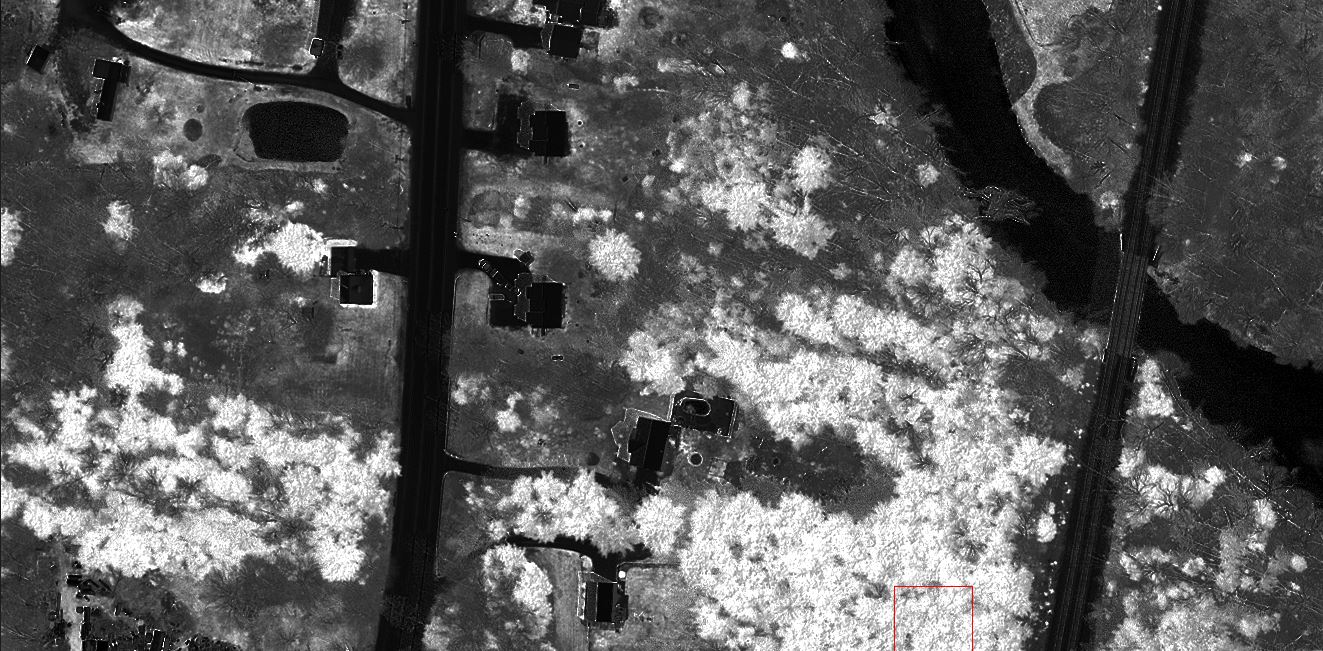
Deciduous vs. Conifer Vegetation Detection for Advanced Viewshed Mapping.
Featured Product: Build Cost Mapping (BCM) Tool
As the project finance capital markets become less fragmented and more streamlined, development fees are increasingly tied to actual project returns rather than market standards. World-class interconnection analysis is pointless if a DG solar project requires $1 million for access roads and stormwater management earthworks.
Bright Lite’s Build Cost Mapping (BCM) Tool enables developers to target sites with above-market developer-fee potential. The BCM Tool calculates all major construction costs for thousands of potential sites in a developer client’s region of interest, enabling project developers to rapidly rank and evaluate sites on the level playing field of build Cost/Watt.
Such components for solar energy project cost analysis include:
- Site work cost required to achieve racking tolerances for a developer’s racking selection
- Site work cost required for access roads
- Site work cost required for clearing, grading, and stumping where necessary
- Relative complexity of stormwater management analysis for permitting cost analysis
- Site work cost required for stormwater management
- Electrical cost collection system from inverters to interconnection points
- Feeder line extension cost on public and private ways to substation to other feeder lines in the event of required system upgrades
- Planting and Grading costs for the construction of visual buffers
The Bright Lite works with the developers to tune tolerances such as slope, aspect, energy production, required capacity factor etc. to map developer’s assumptions rather than market standards.
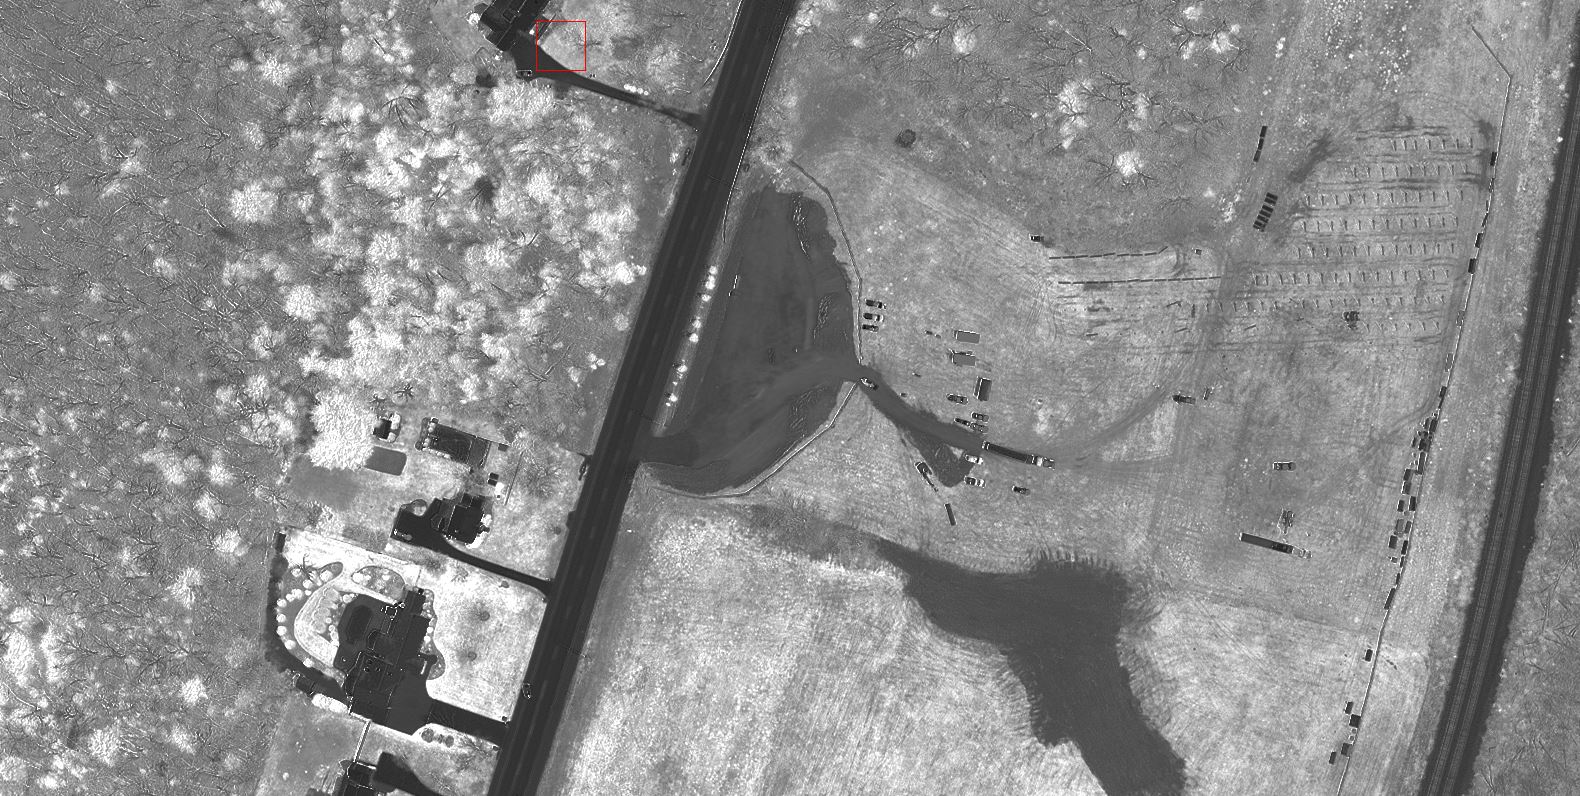
Remotely measuring sitework during construction.
Featured Product: Solventerra’s Shading Impact Analysis (SIA) Tool
Developed by Solventerra LLC, a developer of renewable energy projects in the Northeast United States, the Shading Impact Analysis (SIA) Tool calculates power production in complex shading environments for utility, commercial, and residential projects on an individual site or wide area basis. Developed due to the inability of shading measurement tools to work in forests, the SIA Tool can calculate roof-feature, building, and tree line setbacks and tree-cutting required for target production figures. The SIA tool can also calculate the yearly difference in production by not cutting a tree or sections of trees, which can be helpful for working with neighbors on access to sunlight.
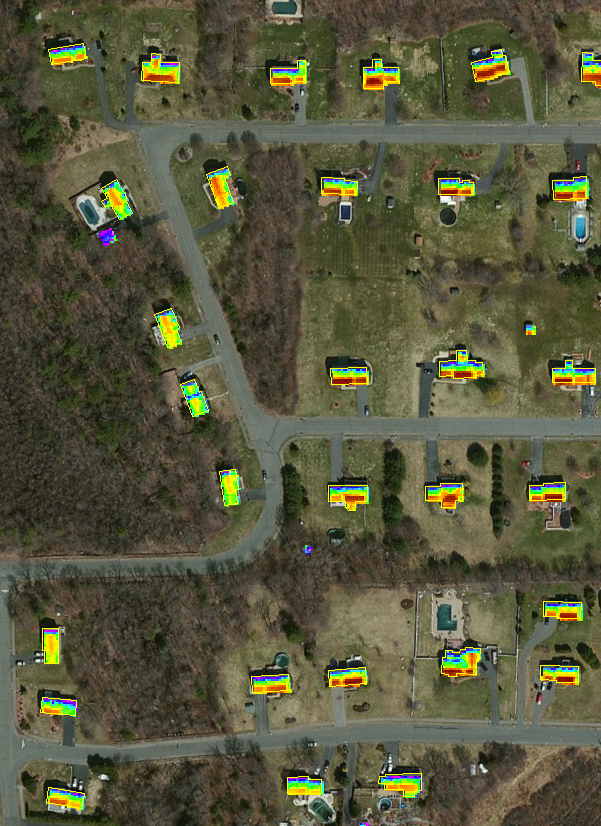
Solventerra & BrightLite are developing a residential prospecting database for purchase by residential developers. We’ve currently calculated power production vs. size (kW) for 248,000 addresses in Massachusetts and are soon to work through data for 12 states. Contact Us today.
Basic Mapping Products
For developers getting into the business, or considering a new region for development, Bright Lite can perform simple geospatial analysis to get developers started. Bright Lite can output this analysis in easy to consume platforms for developers with a phone and laptop such as Google Earth, Maps, and Mapbox. Such geospatial analysis packages include:
- Utility territory mapping
- Environmental constraint mapping for given jurisdictional areas (wetlands, flood plains, endangered species)
- Slope, aspect, landcover, soils analysis constraint mapping
- Residential proximity mapping
No one says project development is an easy business. We say , “It can be.”
Please contact us for further information.